I had a call last week with a business owner who was genuinely confused. Revenue was up 30% year over year. The team was busy. Customers were paying. And yet, he was constantly stressed about cash. "I don't understand," he said. "We're making money. Where is it?"
The answer was sitting in his cash conversion cycle, and he had never once looked at it.
Most owners track revenue. Some track profit. Very few track the actual speed at which their business turns activity into cash in the bank. And that gap, between earning and receiving, is where businesses quietly suffocate.
Here is what was happening in his case. He was buying inventory 60 days before he needed it. His team was slow to invoice after delivery. And customers were taking 45 days to pay. Meanwhile, his suppliers wanted payment in 30 days. Do the math. He was funding a massive gap out of his own pocket every single month, and growing faster just made the hole deeper.
The cash conversion cycle is simply how long it takes from the moment you spend money to the moment you collect it back with margin attached. The shorter that cycle, the less cash you need to operate. The longer it is, the more you are essentially acting as a bank for your customers and your supply chain.
This is not an accounting concept. It is an operational one. And it is one of the most powerful levers an owner can pull without changing a single thing about their product or service.
When you understand your cycle, you stop asking "where did the money go" and start asking "how do I get it back faster."
So here is the question. Do you actually know how long your cash conversion cycle is right now, and if not, what does that tell you about how well you understand your own business?
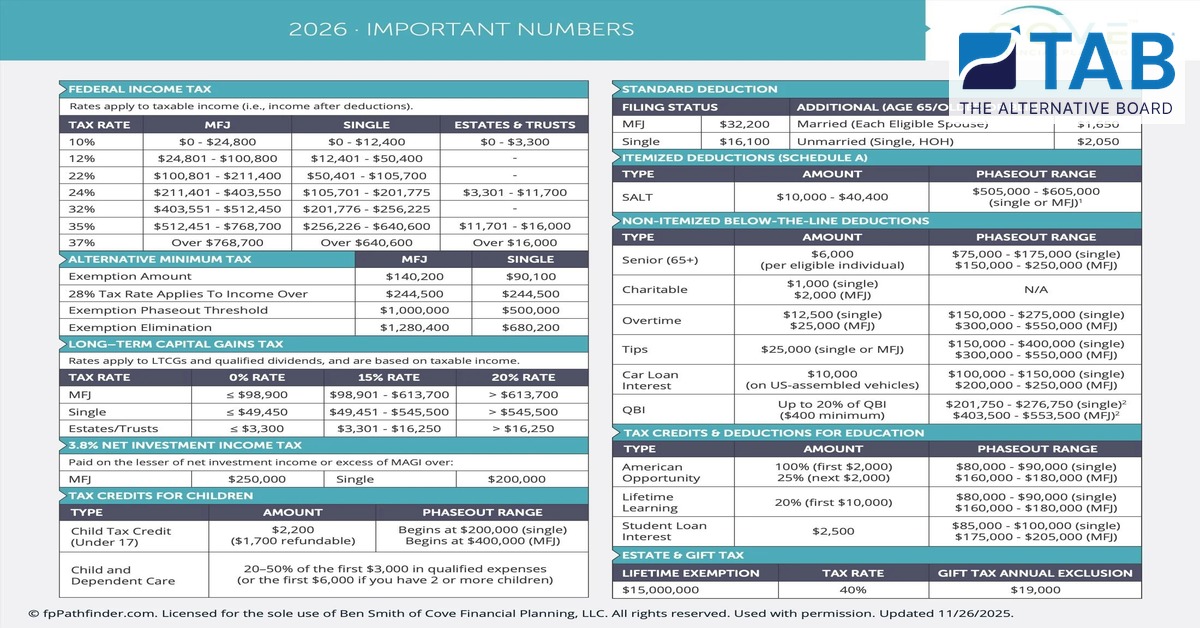
2026 · IMPORTANT NUMBERS
| FEDERAL INCOME TAX |
|---|
| Rates apply to taxable income (i.e., income after deductions). |
|---|
| TAX RATE |
MFJ |
SINGLE |
ESTATES & TRUSTS |
| 10% |
$0 - $24,800 |
$0 - $12,400 |
$0 - $3,300 |
| 12% |
$24,801 - $100,800 |
$12,401 - $50,400 |
- |
| 22% |
$100,801 - $211,400 |
$50,401 - $105,700 |
- |
| 24% |
$211,401 - $403,550 |
$105,701 - $201,775 |
$3,301 - $11,700 |
| 32% |
$403,551 - $512,450 |
$201,776 - $256,225 |
- |
| 35% |
$512,451 - $768,700 |
$256,226 - $640,600 |
$11,701 - $16,000 |
| 37% |
Over $768,700 |
Over $640,600 |
Over $16,000 |
| ALTERNATIVE MINIMUM TAX | MFJ | SINGLE |
|---|
| Exemption Amount | $140,200 | $90,100 |
| 28% Tax Rate Applies To Income Over | $244,500 | $244,500 |
| Exemption Phaseout Threshold | $1,000,000 | $500,000 |
| Exemption Elimination | $1,280,400 | $680,200 |
| LONG-TERM CAPITAL GAINS TAX |
|---|
| Rates apply to LTCGs and qualified dividends, and are based on taxable income. |
|---|
| TAX RATE |
0% RATE |
15% RATE |
20% RATE |
| MFJ |
≤ $98,900 |
$98,901 - $613,700 |
> $613,700 |
| Single |
≤ $49,450 |
$49,451 - $545,500 |
> $545,500 |
| Estates/Trusts |
≤ $3,300 |
$3,301 - $16,250 |
> $16,250 |
| 3.8% NET INVESTMENT INCOME TAX |
|---|
| Paid on the lesser of net investment income or excess of MAGI over: |
|---|
| MFJ: $250,000 | Single: $200,000 |
| TYPE |
AMOUNT |
PHASEOUT RANGE |
| Child Tax Credit (Under 17) |
$2,200 ($1,700 refundable) |
Begins at $200,000 (single) Begins at $400,000 (MFJ) |
| Child and Dependent Care |
20-50% of the first $3,000 in qualified expenses (or the first $6,000 if you have 2 or more children) |
|
| FILING STATUS |
AMOUNT |
ADDITIONAL (AGE 65/OTHER) |
| MFJ |
$32,200 |
Married (Each Eligible Spouse) $1,000 |
| Single |
$16,100 |
Unmarried (Single, HOH) $2,050 |
| ITEMIZED DEDUCTIONS (SCHEDULE A) |
|---|
| TYPE |
AMOUNT |
PHASEOUT RANGE |
| SALT |
$10,000 - $40,400 |
$505,000 - $605,000 (single or MFJ)1 |
| NON-ITEMIZED BELOW-THE-LINE DEDUCTIONS |
|---|
| TYPE |
AMOUNT |
PHASEOUT RANGE |
| Senior (65+) |
$6,000 (per eligible individual) |
$75,000 - $175,000 (single) $150,000 - $250,000 (MFJ) |
| Charitable |
$1,000 (single) $2,000 (MFJ) |
N/A |
| Overtime |
$12,500 (single) $25,000 (MFJ) |
$150,000 - $275,000 (single) $300,000 - $550,000 (MFJ) |
| Tips |
$25,000 (single or MFJ) |
$150,000 - $400,000 (single) $300,000 - $550,000 (MFJ) |
| Car Loan Interest |
$10,000 (on US-assembled vehicles) |
$100,000 - $150,000 (single) $200,000 - $250,000 (MFJ) |
| QBI |
Up to 20% of QBI ($400 minimum) |
$201,750 - $276,750 (single)2 $403,500 - $553,500 (MFJ)2 |
| TAX CREDITS & DEDUCTIONS FOR EDUCATION |
|---|
| TYPE |
AMOUNT |
PHASEOUT RANGE |
| American Opportunity |
100% (first $2,000) 25% (next $2,000) |
$80,000 - $90,000 (single) $160,000 - $180,000 (MFJ) |
| Lifetime Learning |
20% (first $10,000) |
$80,000 - $90,000 (single) $160,000 - $180,000 (MFJ) |
| Student Loan Interest |
$2,500 |
$85,000 - $100,000 (single) $175,000 - $205,000 (MFJ) |
| LIFETIME EXEMPTION |
TAX RATE |
GIFT TAX ANNUAL EXCLUSION |
| $15,000,000 |
40% |
$19,000 |
© fpPathfinder.com. Licensed for the sole use of Ben Smith of Cove Financial Planning, LLC. All rights reserved. Used with permission. Updated 11/26/2025.
From "The Owner's Almanac" - 90 days to build a business that runs without you. Available on Amazon.